|
Back in April 2022, we asked the question: The Fed’s Holdings of MBS Holdings Will Decline, Who Will Buy?[1] The release of the Q1 2023 Z.1 data[2] gives us an opportunity to begin to formulate an answer. In fact, the Fed’s share of holdings of MBS peaked at just under a quarter of the market in Q1 2022 (24.4%) and stood at just over one-fifth of the market in 2023Q1 (20.3%). Below find a table breaking this down by major purchaser. 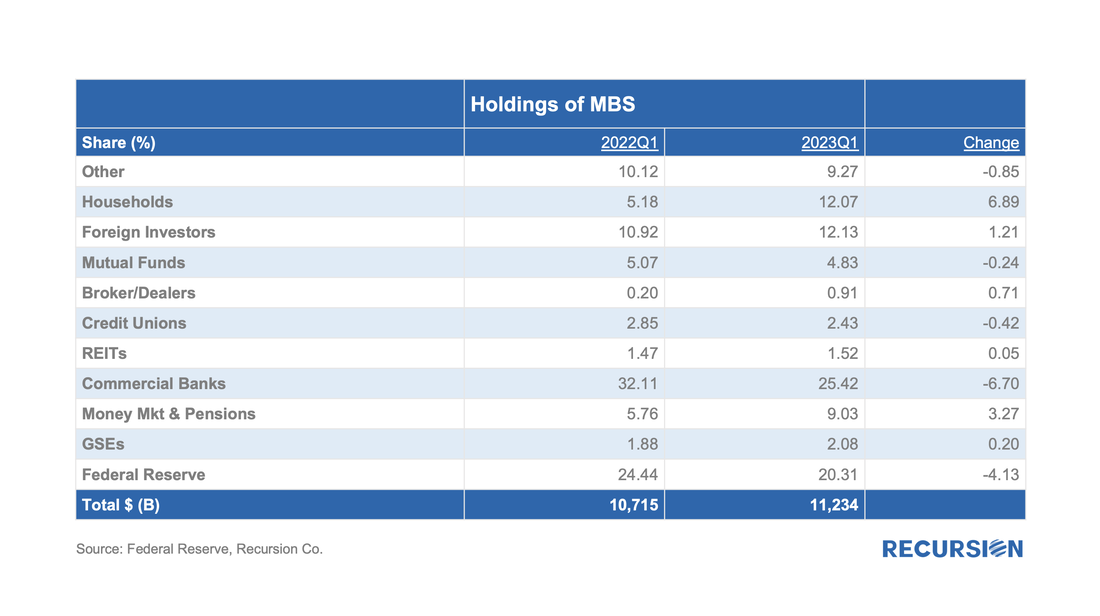 There are two sectors that declined: the Fed and Banks, and two that rose: Money markets and households. There are a few comments below: International Sector The set of international investors in MBS is a complex web of public and private sector participants in developed and emerging markets. They are motivated to invest by a broad range of considerations ranging from short-term returns to currency stabilization. A lot of ink is spilled over these issues, but there is an interesting point to be made that their positions, in aggregate, are motivated to a reasonable first degree by the returns to be found in the market. 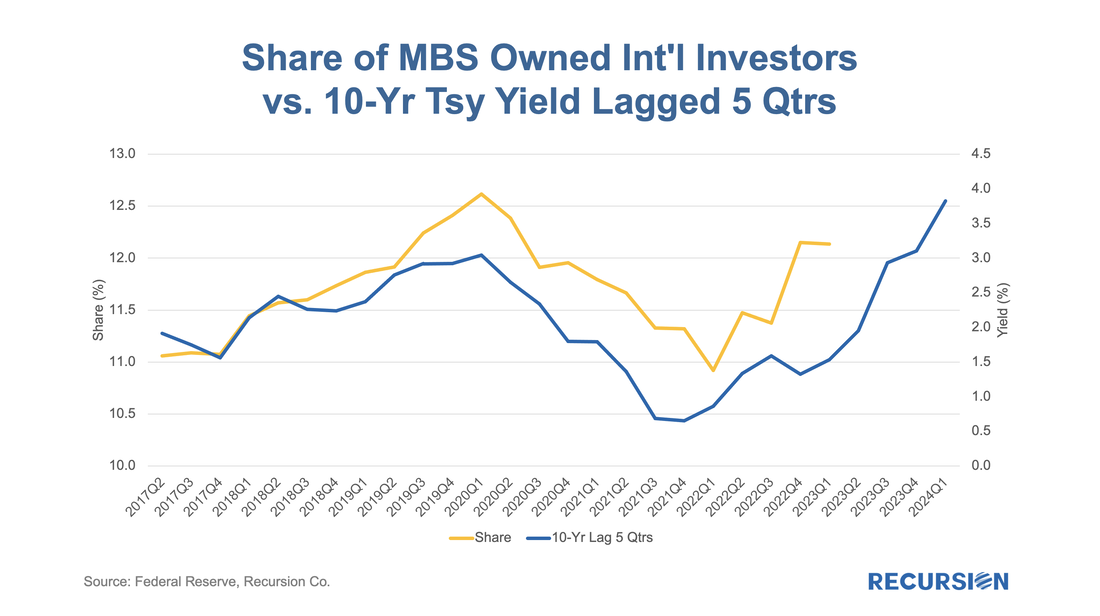 Local stories matter, of course. China remains on a long-term path of decelerating growth, bordering on deflation, weighed down by debt and a slump in the real estate sector. The Yuan is near a 15-year low, and further easing measures could lead to additional currency weakness and associated trade tensions. 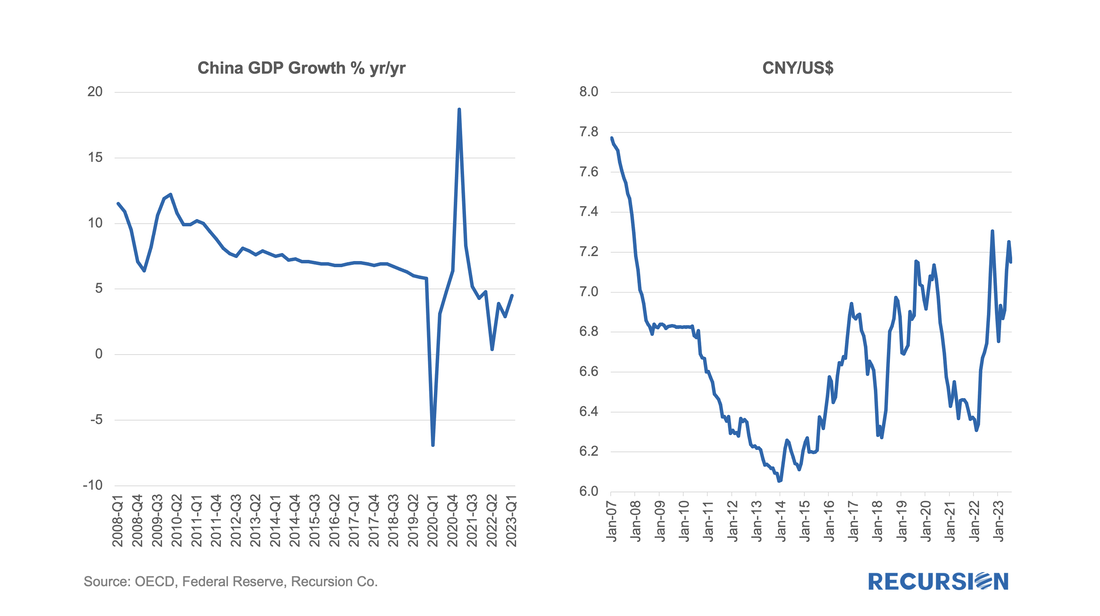 In Japan, the Bank of Japan recently took another step in easing its Yield Curve Control policy that would allow the 10-yr JGB rate to rise. Market concerns are mounting that an acceleration in the yield could lead to widespread adverse market consequences globally, including MBS. 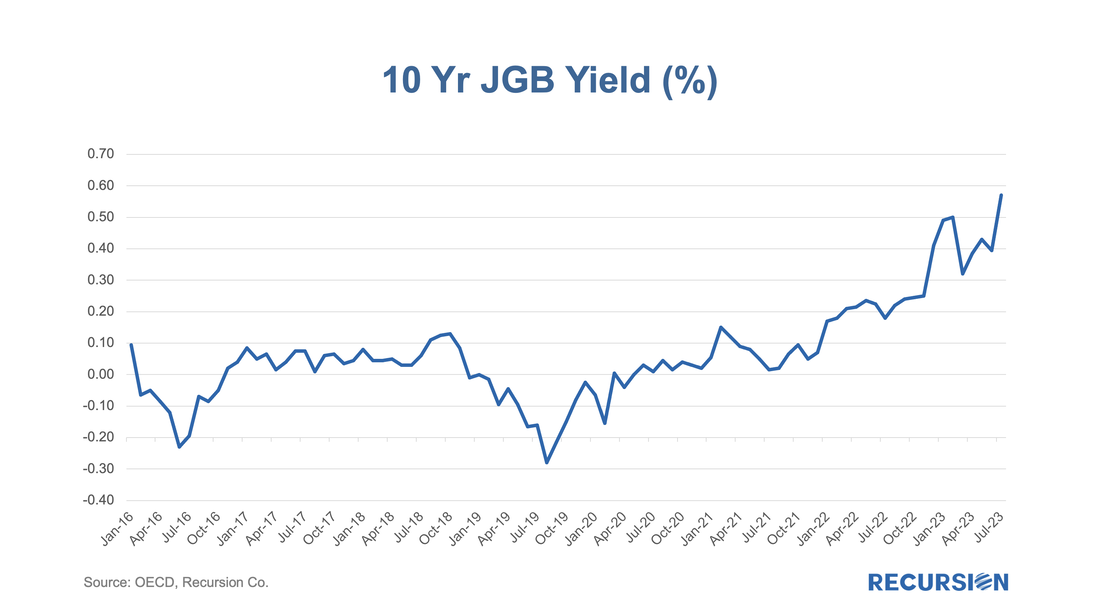 For all this, the share of the international sector rose by just over 1% over the last year. Banks In the previous post, we noted that the shares of bank and Fed holdings are positively correlated. This is because as the Fed sells securities, the funds used by the investors that purchase them often come out of bank deposits. That remains true, but per the table above, the decline in the bank share over the last year exceeded that of the central bank by about 2.6%: 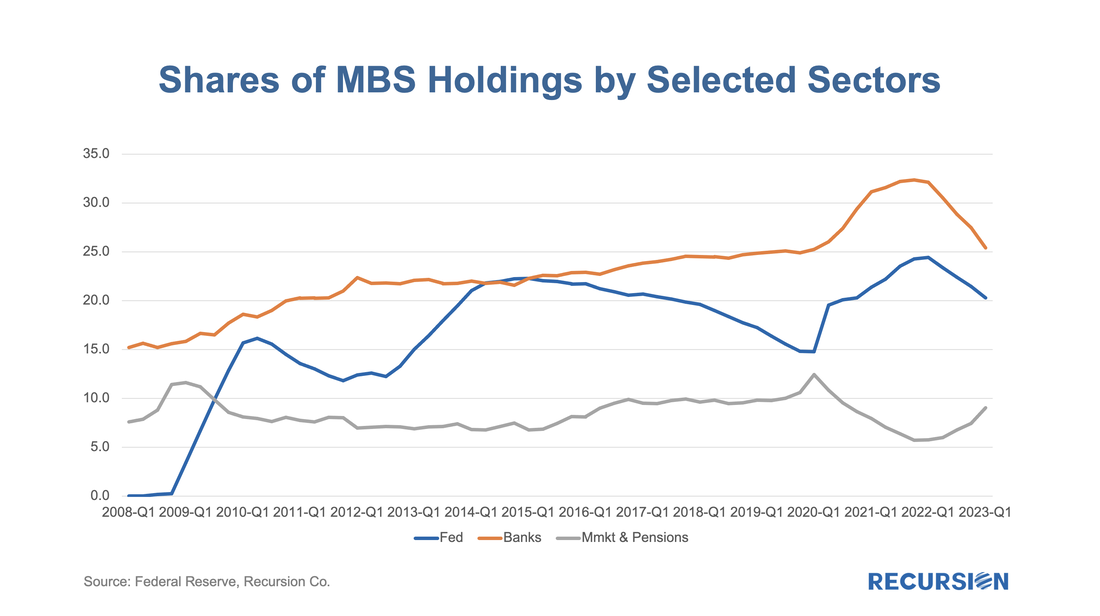 The other factor responsible for the decline in the bank share is higher interest rates which act to draw funds out of depositories into private investment vehicles. Over the past year, the formula “Change in bank share = change in Fed share – change in money market & pension share” is accurate within 1%. Private Investors Most analysts, us included, have been looking for the private sector to pick up its MBS holdings as the Fed steps back. That has in fact occurred, but with an unexpected twist. Below find the shares of holdings over time for mutual funds and households[3]: 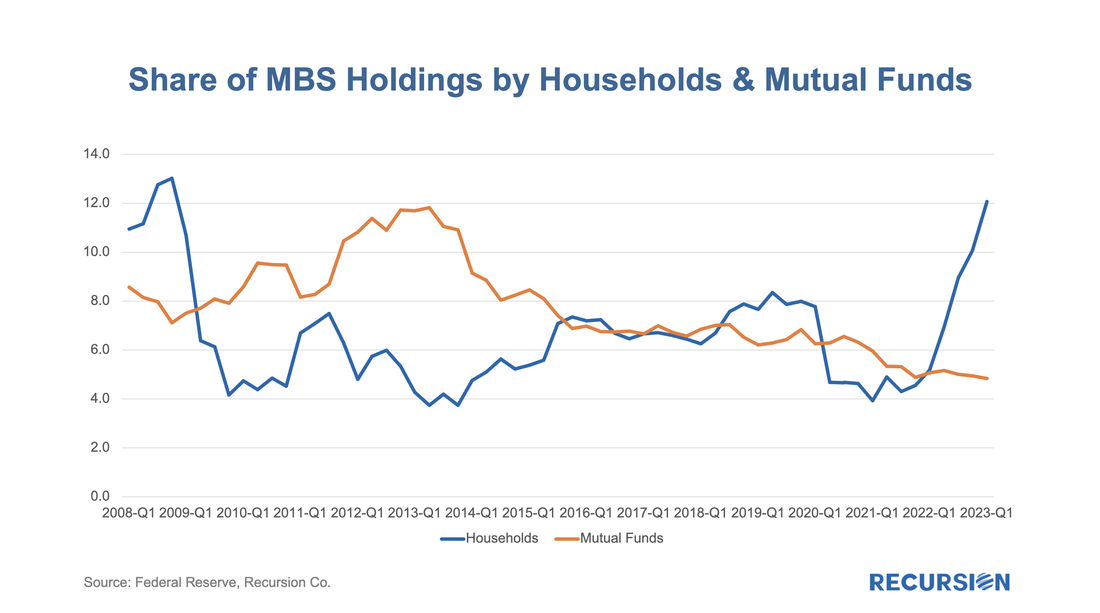 The share of MBS held in mutual funds has declined steadily since 2014, with no evidence yet that higher yields are attracting more funds into this sector. The striking result is a surge in ownership by the household sector, now accounting for over 12% of the total, the highest level attained since the GFC was raging, and the integrity of the banking sector was widely questioned. In June 2022, CPI inflation was reported at 8.9% yr/yr, the highest rate since 1981. Along with ChatGPT and the metaverse, our younger readers can learn a new term: coupon clip. It was all the rage in the early ‘80s, along with “Indiana Jones”. Wait long enough and everything comes back. [1] https://www.recursionco.com/blog/the-feds-holdings-of-mbs-will-decline-who-will-buy
[2] https://www.federalreserve.gov/releases/z1/ [3] “The households and nonprofit organizations sector is the residual holder of agency- and GSE-backed securities.”https://www.federalreserve.gov/apps/fof/SeriesAnalyzer.aspx?s=LM153061705&t=L.101&suf=Q The value of research depends on the consumer. Traders look for actionable ideas to shore up their P/(L), policymakers look for insights into the impact of various regulatory changes, and risk managers look for potholes in the road ahead. The best research informs all of these constituencies by impacting the “big picture” thinking of all of these constituencies. We just got a fine example of the latter from a new paper by Camelia Minoiu of the Atlanta Federal Reserve, and Andres Schneider and Min Wei of the Federal Reserve Board, “Why Does the Yield Curve Predict GDP Growth? The Role of Banks.”[1] An old puzzle in economics is why Treasury Curve yield flattening is an excellent predictor of recessions. The authors conduct a comprehensive investigation into the role of banks in the relationship. A lower term premium, they argue, reduces profitability and the availability of credit. What does this have to do with the mortgage market? Mortgage credit is provided by both banks and nonbanks. Nonbanks, it may be argued, are monoline credit providers whose credit provision is less impacted by this factor. This leads us to the following chart: 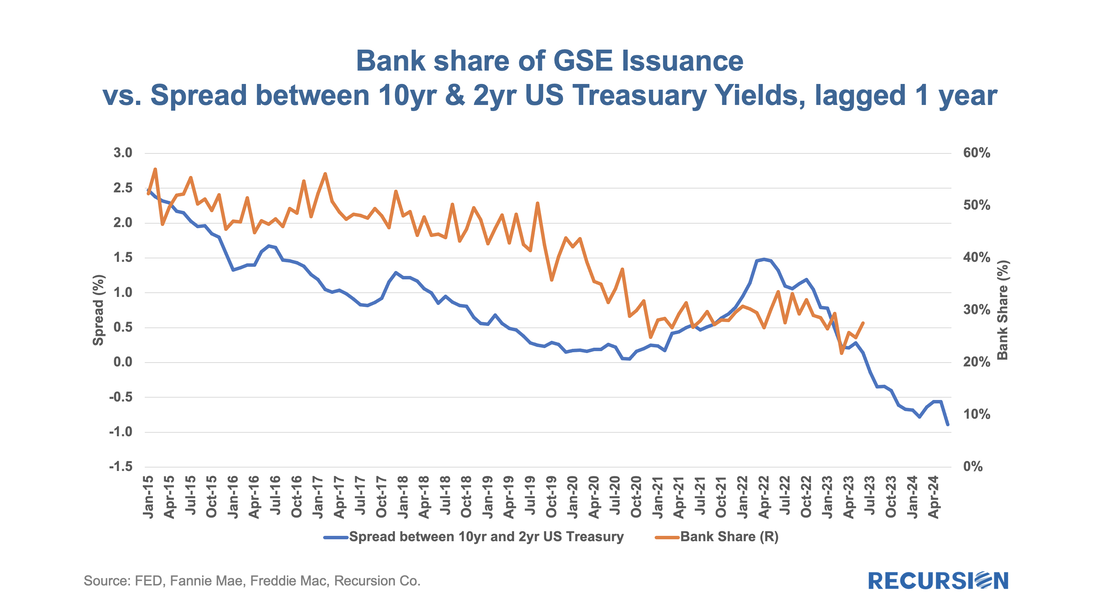 As daily April Agency mortgage loan delivery data completed, we found convincing evidence that the freeze in market activities we have witnessed since the fourth quarter of 2022 is continuing, although there are some new twists. Here is the chart for the loan counts of purchase market deliveries to the GSEs back to 2019. Rather than do this as a time series, we stack the years over an annual monthly x-axis to better correct for the seasonality in the time series: 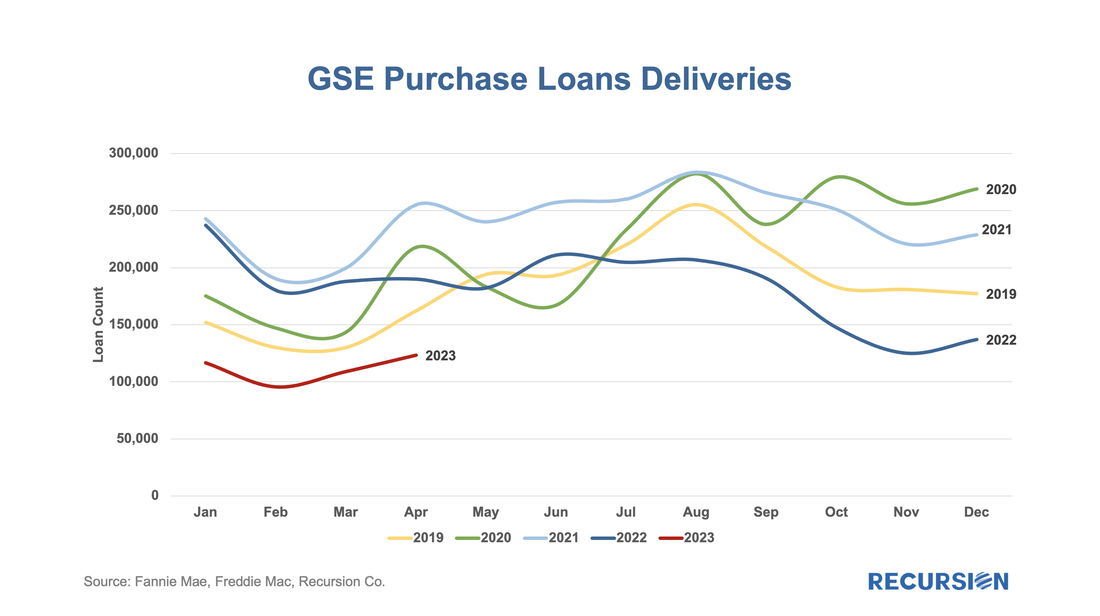 The cherry blossoms are blooming, which means it’s time for the HMDA preliminary data set to be released. The dataset provides a social underpinning to the nation’s mortgage market and enhances our understanding of the behavior of borrowers and lenders. The 2022 dataset has been particularly eagerly awaited, as we get our view on the new world of high inflation and mortgage rates for the first time in decades. We start with origination volumes and get not just confirmation of the onset of mortgage winter, but some breakdown of its characteristics.
In recent posts, we introduced the phrase “Mortgage Winter” to describe the current environment where high-interest rates and elevated home prices lead to a severe drop in transaction volumes[1]. Subsequently, we looked at the impact of this situation on individual market participants[2]. The bulk of market participants across the mortgage ecosystem is experiencing year/year revenue declines of two-thirds or more. These entities are having to adjust their business models to this situation and develop strategies to navigate the uncertain environment ahead. Spring will come, but whether the ensuing rebound will be sufficient to return the sector to a state of financial health is a question that remains far from assured. There is also another factor to consider besides revenue, and that is the potential for increased servicing costs associated with delinquent borrowers. 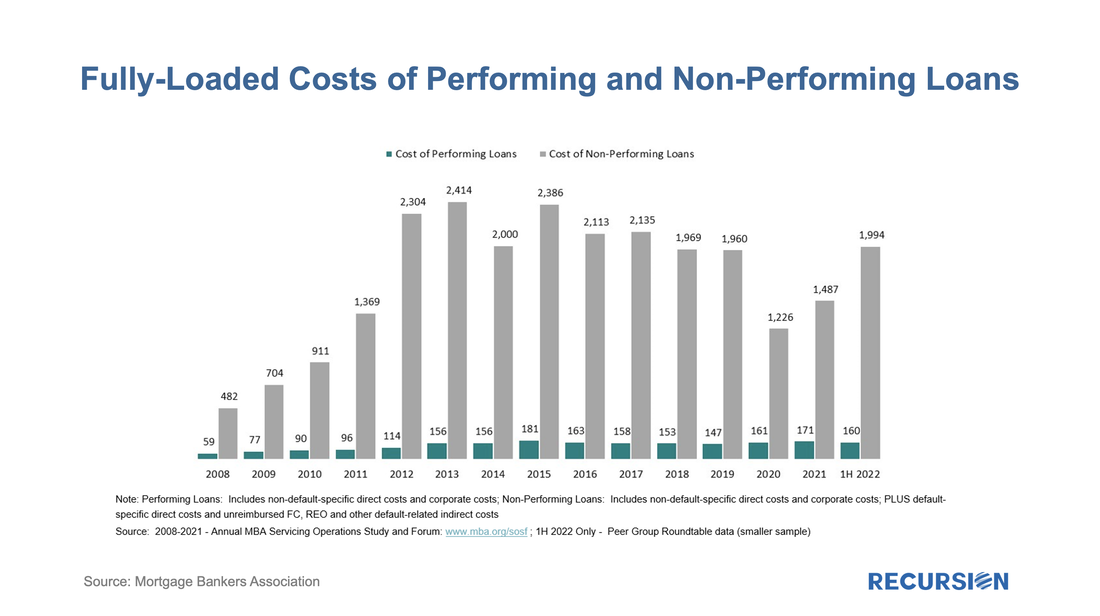 Growing concerns about a looming recession combined with increasing signs of distress in Government mortgage programs, particularly FHA, are leading many market participants to step up their focus on GSE buyouts. These found a recent peak last winter as forbearance programs unwound and have been in a generally declining trend since that time. 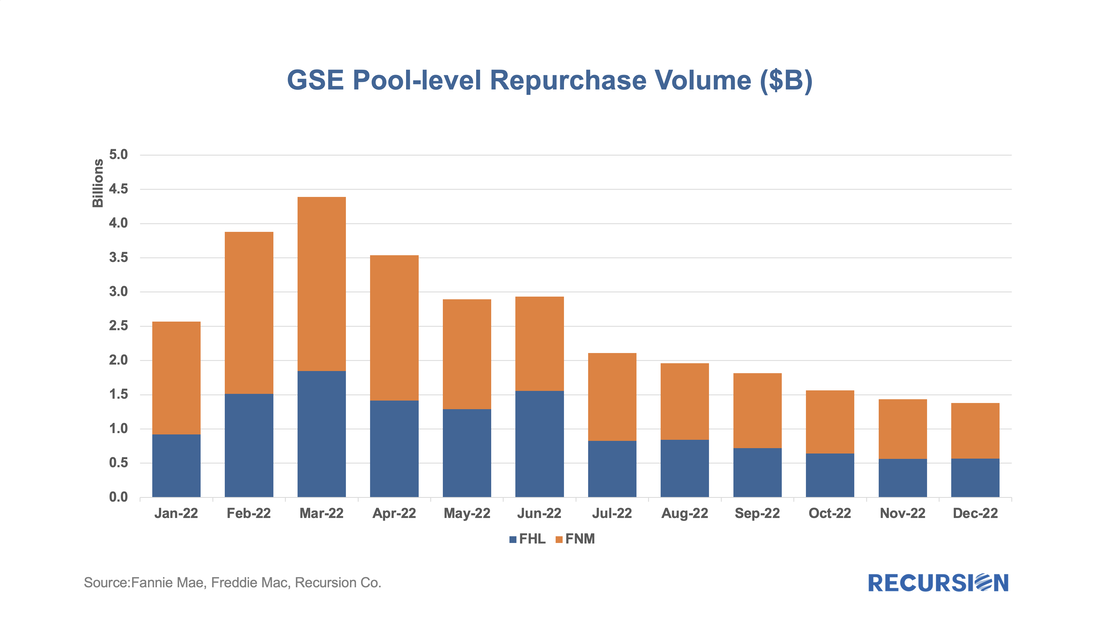 In a recent post[1], we spoke about how the current market environment of high interest and home prices is leading to downward pressure on both supply and demand in the housing market, a situation we call "Mortgage Winter". While this environment is unlikely to result in a severe recession such as the Global Financial Crisis, there is the potential for broad fallout associated with distress in the lender and broker markets. First, we look at the originations. The count of loans that were delivered to the three agencies dropped by 68% from Q4 2021 to Q4 2022: 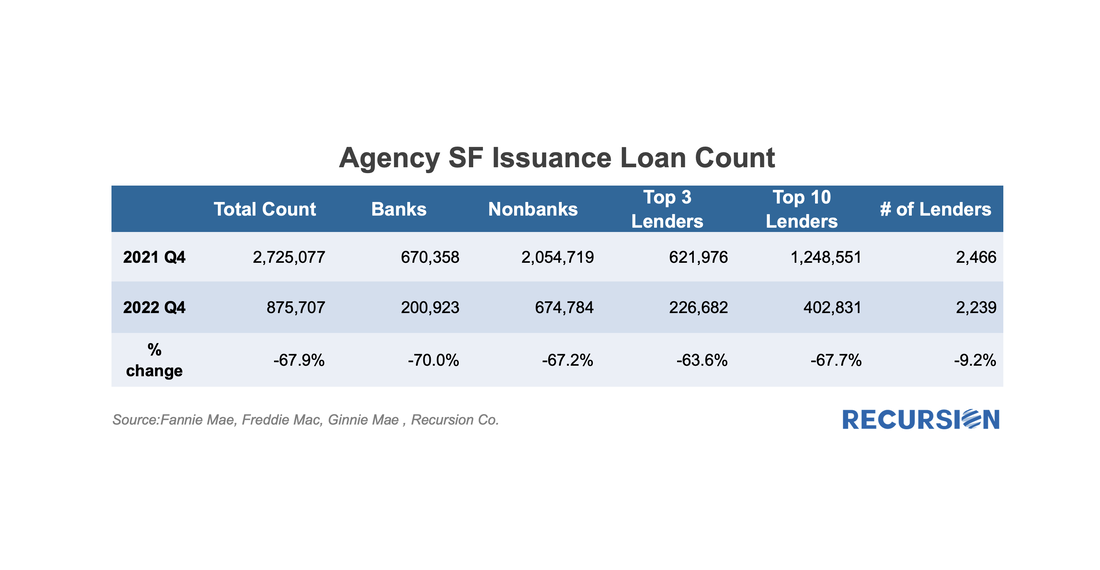 Usually, when we talk about financial institutions in our posts, we focus on sellers and/or servicers as we have a clear view from the Agency disclosures. An interesting distinction in this regard is to break down originations between those sourced through a retail channel within the lending institutions and those purchased from other lenders, known as third-party originations (TPOs). We are often asked the question in the case of TPO lending, where only sponsors of the mortgages are reported, who are the originators? This information is not reported in the agency loan-level disclosure. We can supplement this information by examining originators in the HMDA data by observing the fact a TPO (correspondent or broker) loan is often reported twice, one record reported by the originator and another reported by the sponsor. At Recursion, we conducted an exercise by matching the pairs together, and we were able to identify the counterparty pairs for about 50% of the mortgages marked as “purchased”, and also made this revealing data point to our HMDA Analyzer users. According to the 2021 HMDA preliminary release, about 2.65 million loans were purchased from other lenders that year, about 18% of all originations. Roughly half of these purchases were made by 10 institutions: 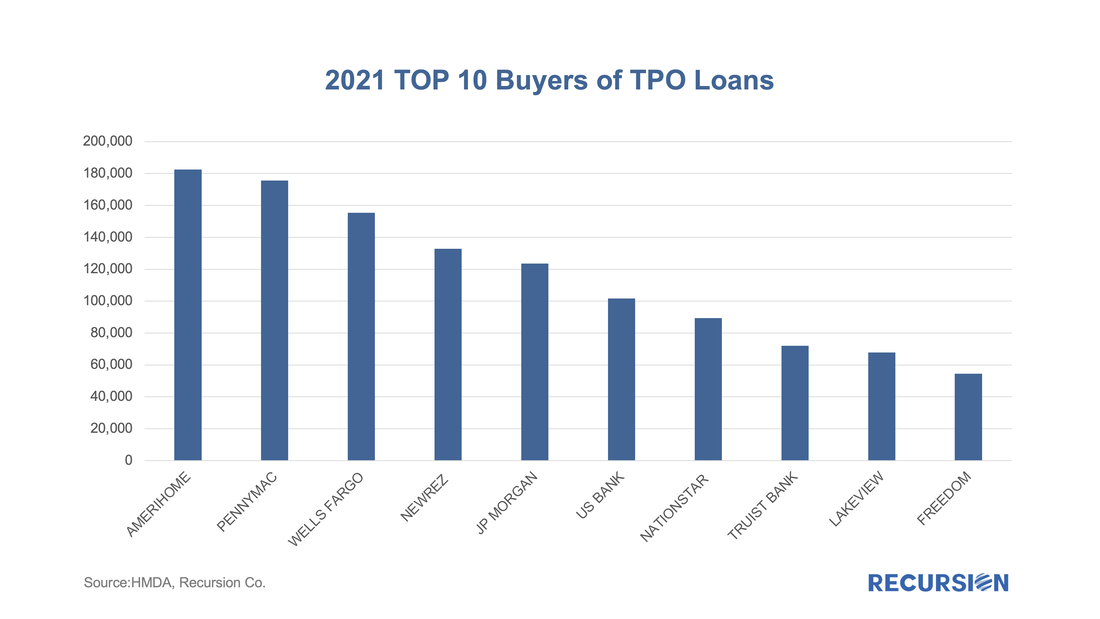 |
Archives
February 2024
Tags
All
|
 RSS Feed
RECURSION |
|

Copyright © 2022 Recursion, Co. All rights reserved.